Archive detail
Drinking water unexpectedly rich in microbial life
January 24, 2013 |
For over 100 years, the method used to assess the microbiological safety of drinking water has remained essentially unchanged: bacteria present in water are allowed to grow on solid nutrient media (incubated at a warm temperature), and the colonies formed are then counted. The intestinal bacteria Escherichia coli and enterococci serve as indicators of faecal contamination. At the same time, the heterotrophic plate count (HPC) is determined as a measure of general microbiological quality. This method quantifies all the microorganisms present which can reproduce at temperatures of around 20–45°C (mesophilic). According to the global standard, the number of colonies formed should not exceed 300 per millilitre.
Cell counts significantly underestimated
The cultivation-based method has two major drawbacks: it is time-consuming – results are only available after 3–10 days in the case of the HPC – and only a fraction of the living cells actually present in samples are counted. This is because the method only detects those bacteria which can grow and form colonies under the specified conditions – generally 0.01–1% of the total. Thus, the limit of 300 colony-forming units per millilitre (CFU/mL) also specified in the Swiss Ordinance on Food Hygiene (HyV) is based on a significant underestimate of the actual number of microorganisms present. The cultivation of E. coli and enterococci does, however, normally yield reliable results. (Total cell counts for different types of water are shown in Fig. 1.)
Total cell count and fingerprint
In December 2012, the FOPH incorporated method no. 333 “Determining the total cell count and ratios of high and low nucleic acid content cells in freshwater using flow cytometry” into the Swiss Food Compendium as a recommended test method. Instead of the HPC, which is no longer considered relevant for food hygiene purposes, FCM (see Box) can now be used to determine the total cell count in a water sample within a matter of minutes. Unlike the AMC, this count provides a realistic indication of the microbial content of water and – at least indirectly – allows conclusions to be drawn about contamination. In addition, with the same method, the ratio of larger to smaller cells can also be determined (i.e. cells with a high or low nucleic acid content). This is seen by experts as the “fingerprint” of drinking water: sudden changes in this value may indicate, for example, damage or misconnections in the water network, or faults at water treatment facilities.
New standard method
Switzerland is the first country worldwide to have adopted this advanced method for the quantification of microbial cells in water. Eawag drinking water specialist Stefan Koetzsch believes that other countries, such as the Netherlands, will follow soon. Given the much higher total cell counts, should the federal authorities now specify new limits? “No,” says Koetzsch, “that would not be appropriate; nor would it really be possible since the microbiological composition of water will depend on its particular origin, and high cell counts do not in themselves provide conclusive evidence of possible pathogens” (see Fig. 1). However, Koetzsch and his colleagues are convinced that FCM will become established as a new standard in the monitoring of drinking water. The method is ideally suited for monitoring an entire supply system (from drinking water abstraction through treatment and distribution to consumers), optimizing processes and identifying problems. Efforts are already underway to develop an automated version of the method, which would permit “online” monitoring of bacterial cell counts.
How does flow cytometry work?
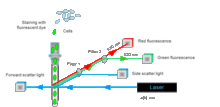
Flow cytometry was developed for applications in the field of medicine, where it has been used since the 1980s, e.g. for counting (relatively large) blood cells. When this method is employed for drinking water analysis, the (generally small) cells contained in a sample are first stained with fluorescent dyes, which bind to DNA. The cells are then passed in single file through a glass capillary, where they are exposed to a beam of light from a laser. The resultant scatter and fluorescence signals are picked up by detectors, and analytical software is used to classify each individual particle (cell).
Free use of the pictures only in connection with this media information, no archiving.
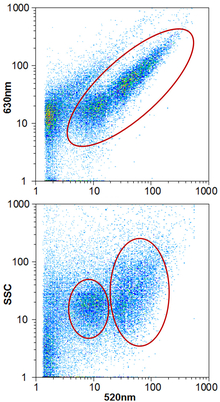
Fig. 3.
Typical results of water analysis by flow cytometry. Top: Based on the ratio of green (520 nm wavelength) to red (630 nm) fluorescence, cells can be distinguished from other particles and counted. Bottom: Green fluorescence is plotted against side scatter (SSC) to determine the ratio of low and high nucleic acid content cells

![[Translate to English:] Abtasten der Proben im Durchflusszytometer mit Laserlicht](/fileadmin/_processed_/7/7/csm_teaser_56dc86b8ce.jpg)


