Department Sanitation, Water and Solid Waste for Development
Water Flow Diagram
A tool for visualising urban water systems and accelerating more inclusive and integrated urban water management
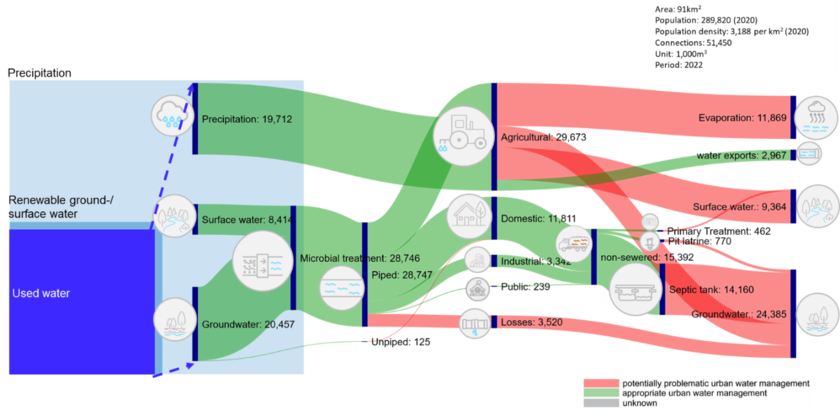
To manage urban water, it is necessary to know its flows and stocks and the issues at stake. Together with our partners we have developed an easy-to-understand diagram to visualize urban water flows and make urban water management tangible for a broad audience. The aim is to empower municipalities and the local stakeholders to work towards reducing inequity and increasing resilience in urban water management. The Water Flow Diagram (WFD) is a visual tool that shows in one picture all the water resources and flows, and it identifies the challenges and opportunities related to SDG6 and the Human Right to Water and Sanitation (HRWS). It connects information related to both Water Sanitation and Hygiene (WASH) and Integrated Water Resources Management (IWRM) and assists in the creation of a joint vision to prioritise action.
The WFD has three main purposes:
- Advocacy and awareness raising: the diagram visualizes the water situation in an intuitive manner that is easy to understand, also to people outside the sector, and highlights areas where political action is needed.
- Launch the dialogue: the diagram can serve as a basis for a constructive multi-stakeholder dialogue including actors from politics, the civil society and the industry.
- Support better decision-making: visualizing the quantities and qualities of water allocated for different activities within a city will facilitate the identification of problematic areas or opportunities. This could influence political priorities and decisions and support the provision of the SDG 6 and the HRWS.
Background
Urbanisation in a changing climate provides specific challenges, but also opportunities, to reach SDG6 and the human right to water and sanitation (HRWS). Key challenges are inequalities and conflicts of interest in water resource distribution, overexploitation, pollution, and water related hazards, such as droughts and floods. The opportunities are economies of scale, improved stormwater harvesting, and circular approaches, using synergies between different water users.
To manage urban water, it is necessary to know its flows and stocks and the issues at stake.
The idea for a Water Flow Diagram emerged during an Aguasan meeting in 2020. Together with the Swiss Development cooperation (SDC), UNICEF, the Stockholm Environment Institute (SEI), the aid organization of the Swiss Protestant Churches (HEKS) and the Swiss Water Partnership (SWP) the concept was further developed. Three case study diagrams were elaborated and presented at the World Water Week in Stockholm 2021.
On the basis of positive feedback received, Eawag further developed the methodology and a user-friendly guide on how to generate a WFD. The methodology was presented at the World Water Forum in Dakar 2022 and the UN water conference in New York in 2023. This led to a joint commitment to the UN Water Action Agenda. The WFD currently is being tested in cities around the world in Brasil, Switzerland, the Philippines, Senegal and Uganda.
Make your own Water Flow Diagram
Organisations around the globe are invited to use the methodology for creating a WFD and make water management practices visible in their city! A user guide and the necessary templates can be downloaded below.
Project documents and links:
Sign up here to receive news about the Water Flow Diagram!

